Alert Management
Alert Management is a key part of ORNA’s “Detect” feature set, effectively representing a fully-fledged Extended Detection and Response (XDR) functionality, seamlessly integrated with the rest of the ORNA platform, particularly workflows and features that are a part of “Respond” and “Prevent” core areas.
NoteTo enable ORNA’s Alerts and populate the Alerts Dashboard, you must first either 1) Set up at least one monitored asset using ORNA’s own Scout monitoring agent; or 2) Configure an integration with a supported 3rd party EDR/XDR system in Settings. Head to this guide's Quickstart or Asset Management sections to learn how to do that.
Alert Management features
ORNA’s alert management includes the following features:
-
Automatic 24/7 threat detection across thousands of complex attack scenarios, including data exfiltration, anomaly-based detection of user-related events, malware detection, file integrity analysis, and many more.
-
Automatic high-accuracy 24/7 threat correlation and triage within 1/80,000s of a second.
-
Automatic de-duplication of security Events into Alerts based on threat intelligence and heuristic analysis.
-
Quantitative (0-15) and qualitative (Low to Critical) criticality/severity analysis for each Alert and suspected Incident.
-
A filtering feature to view Alerts chart over a specific period of time and dates.
-
A notification feature for receiving new Alert summaries and various updates related to Alerts and Incidents via email or SMS.
-
Four pie charts display a breakdown of alerts based on their criticality grouping.
-
Four pie charts displaying the Top 5 Most Compromised (i.e., most Alerts detected) Assets, the Top 5 Compromised Asset Types (e.g., Hardware), the Top 5 Alerting Sources by volume (e.g., ORNA Scout, Suricata, Trend Micro), and Top 5 Attack Tactics used across all alerts (e.g., credentials access).
-
Different types of alert list/table filtering and grouping:
| List type | Description |
|---|---|
| All | This default list type contains all alerts. |
| By Groups | Alerts are categorized based on specific custom groups (e.g., Failed Login Attempts). Can be sorted based on Name, Description, Time, and Created By. |
| By Assets | Alerts are categorized per specific monitored assets, similar to what you can see within the Assets dashboard. Can be sorted based on Label, Created At, and Added By. |
| By Rules | Alerts are categorized by particular detection rules. The detection ruleset can be viewed and customized in your organization’s Settings. |
- Various alert status filters:
| Status | Description |
|---|---|
| All Open | Any open Alerts. |
| Under Investigation | Alerts under investigation. |
| Resolved | Resolved Alerts. |
| Pending | Alerts that are pending investigation. |
| Ignore | Alerts marked as ignored manually or automatically based on the “Ignore” setting per the detection ruleset configuration. |
Accessing the Alerts dashboard
To access the Alerts Dashboard, navigate to the Overview section of the platform and click on the Alerts tab in the top right corner of the Overview dashboard.
Configuring the Alerts table
To configure the Alerts table per your preferences, follow these steps below:
- Navigate to the Overview section of the platform and click on the Alerts tab in the top right corner of the Overview dashboard.
- Click the “...” Options button on the right-hand side of the Alerts table and select Configure Table from the list of options.
- Configure the table as desired and close the popup by clicking “X” in the top right corner. As with any other ORNA table, these preferences will only be saved for your account and will not affect other users’ views.
Viewing and configuring ORNA's Alerts dashboard
Viewing Alert details
To view the details of a specific Alert, follow these steps:
- Navigate to the Overview section of the platform and click on the Alerts tab, located in the top right corner of the Overview dashboard.
- Click on any Alert record in the list to view its details and browse all de-duplicated security Events it contains.
NoteYou can also view any Alert in JSON format for more technical information using the JSON tab in the top right-hand corner of the Alert Details screen.
- You can click on any individual Event to view further details, including Indicators of Compromise, if any were detected during automatic triage.
Using Theia AI in Alert details
To inquire about a specific Alert and receive a context-specific response from Theia, follow the steps below:
- Navigate to the Overview section of the platform and click on the Alerts tab, located in the top right corner of the Overview dashboard.
- Click on any Alert record in the list to view its details.
- Click on one of the available Theia prompts (for example, “Why is this important?”, “What should I do about this?”) to receive a user-friendly contextual description from ORNA’s AI engine, Theia. Theia will respond via a chat message at the bottom of the Alert Details screen.
Changing Alert status (disposition)
Alert dispositions, custom and built-in, allow you to group Alerts based on specific criteria, such as their resolution status:
- Navigate to the Overview section of the platform and click on the Alerts tab, located in the top right corner of the Overview dashboard.
- Select the Alert record you’d like to link to an Asset and click the “...” Options button on the right-hand side of the record. Hover over the “More” option in the list.
NoteYou can work with many Alerts simultaneously by selecting them using checkboxes on the left-hand side of each record.
- Select the new disposition (Under Investigation, Resolved, Pending, or Ignore) under the Move To label and click on it to confirm. The alert will now be assigned this new status.
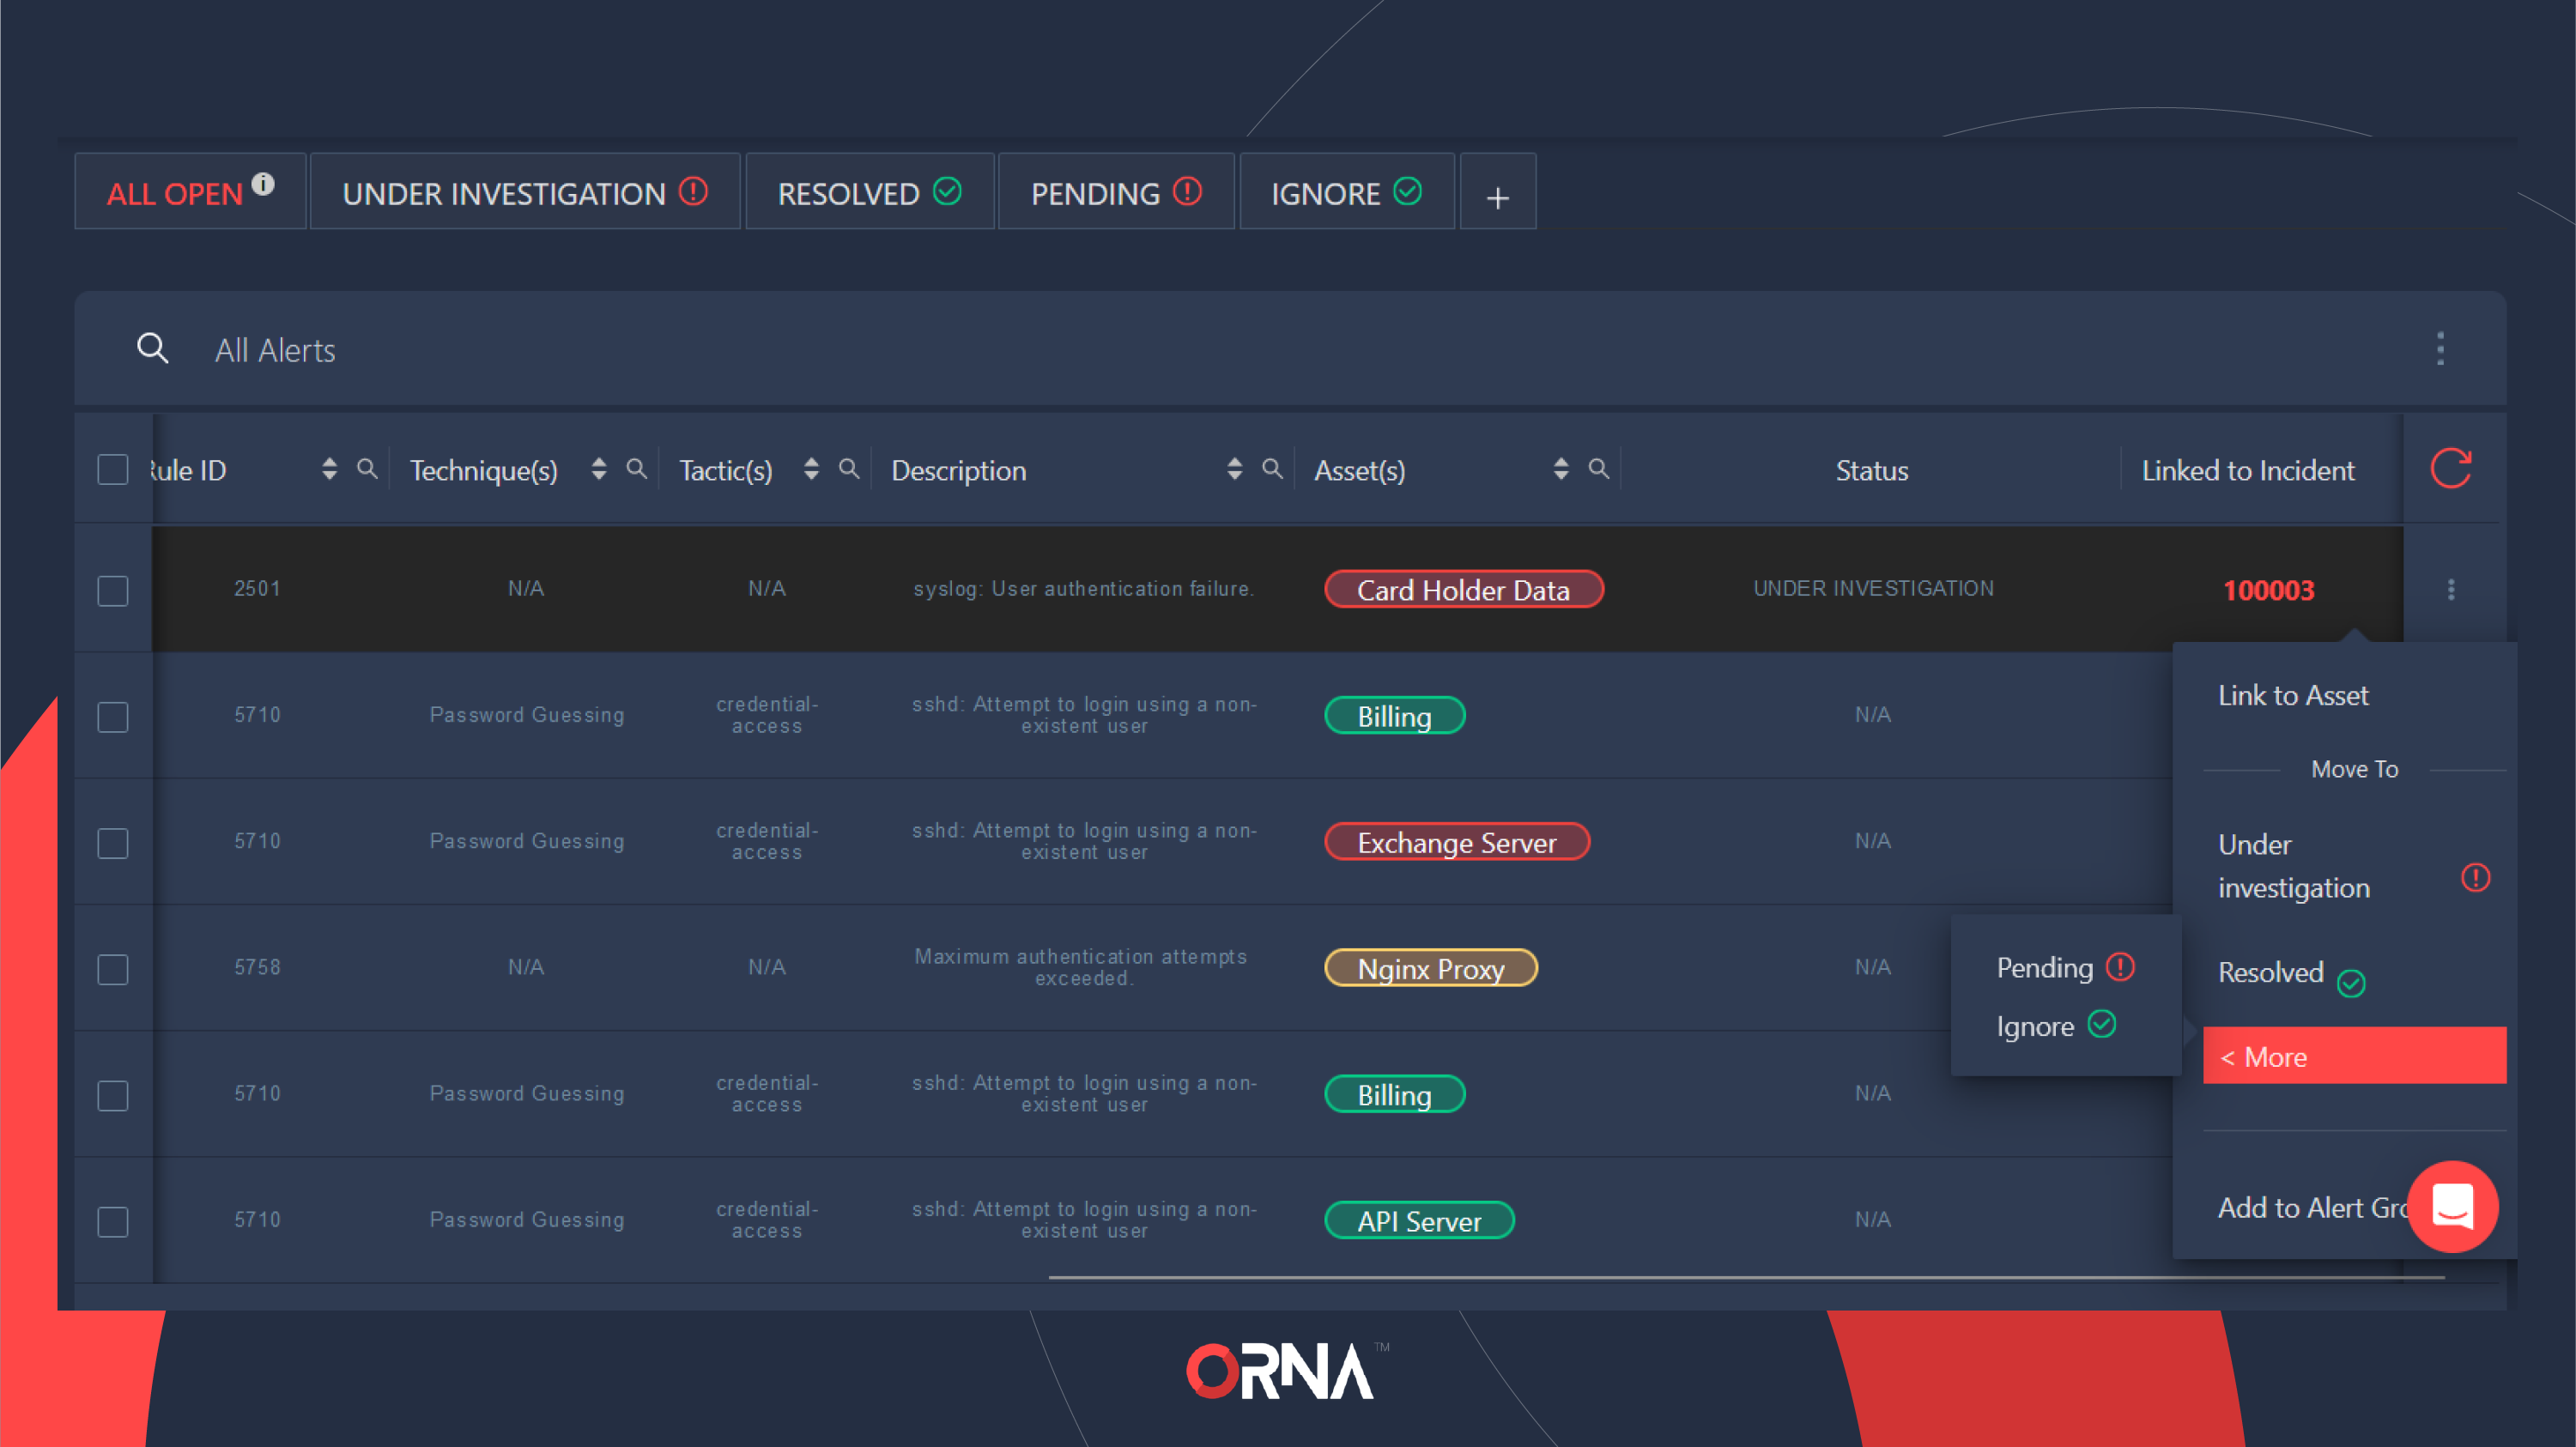
Changing the disposition of a single Alert
Upgrading Alerts to Incidents
Based on your judgment and review of any alert’s details, you might conclude that incident response procedures (and, therefore, Playbooks) need to be invoked for this specific threat.
To upgrade any Alert to the status of an Incident and automatically invoke the relevant Playbook (e.g., Ransomware), follow the steps below:
- Navigate to the Overview section of the platform and click on the Alerts tab, located in the top right corner of the Overview dashboard.
Upgrading an Alert to an Incident
NoteYou can also add one or more Alerts to an existing Incident by clicking the “Add to Incident” button in the bottom right corner of the Alert Details screen.
- Click the record (row) of the Alert to view its details.
- Click the “New Incident” button in the bottom right corner of the screen.
- This will take you to the Incident Summary screen, the same one you’d see if you created an Incident manually, but with some, or all, of the details populated automatically based on the data ORNA collected from analyzing the relevant Alert.
NoteTo learn more, view the Incident Management section of this guide.
- Review and optionally edit the details of the Incident, and click Finalize on the Incident Summary screen to create the Incident.
- This will:
- Invoke the relevant Playbook corresponding to the indicated Incident Type and automatically notify all relevant team members via email or SMS, per their notification preferences;
- Automatically assign all incident resolution Tasks per the Roles assigned to team members.
Linking Alerts to Specific Assets
Typically, ORNA automatically links all relevant Alerts to a specific monitored Asset, which is the source of the Alert in question. However, you can follow these steps to link any Alert to an Asset manually:
- Navigate to the Overview section of the platform and click on the Alerts tab in the top right corner of the Overview dashboard.
- Select the Alert record you’d like to link to an Asset and click the “...” Options button on the right-hand side of the record. Select the Link to Asset option from the list.
- Select the asset you’d like to link this Alert to.
- Finalize by clicking the Link Asset button. This Asset will now be considered one of the assets compromised/affected by this Alert.
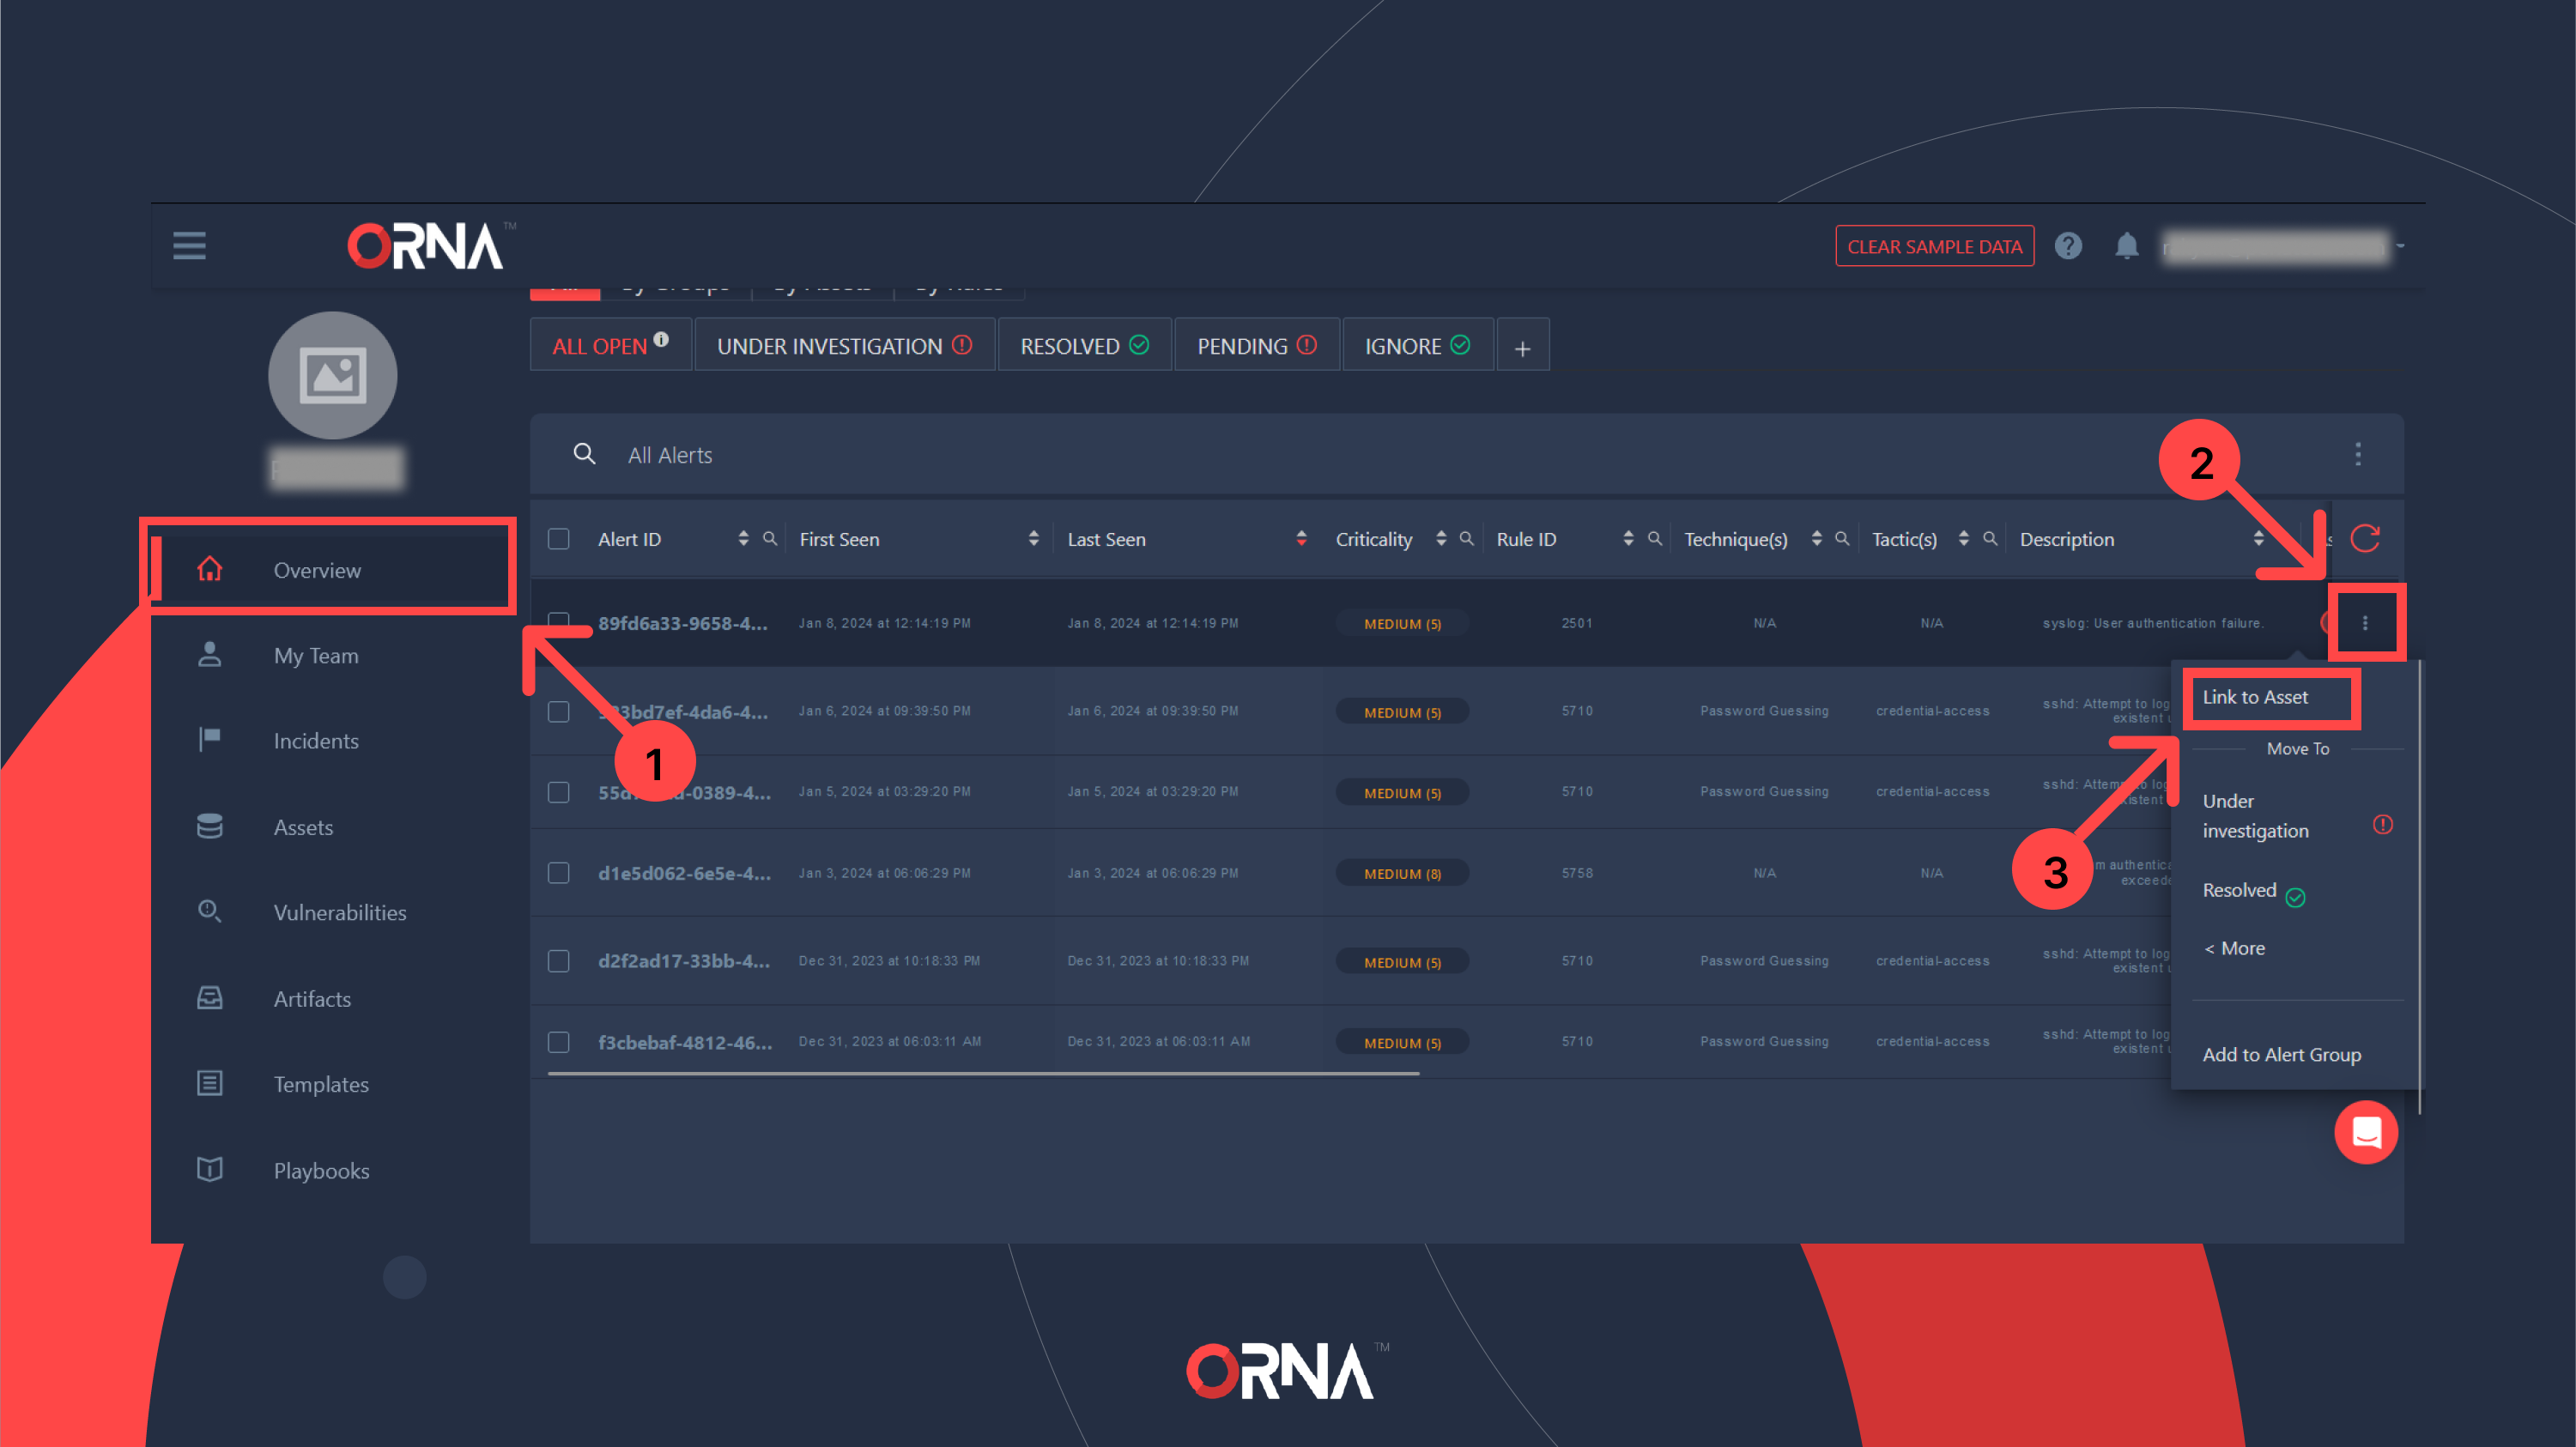

Manually linking an Alert to an Asset
Exporting Alerts
To export alert records, follow the steps below:
- Navigate to the Overview section of the platform and click on the Alerts tab, located in the top right corner of the Overview dashboard.
- Click the “...” Options button on the right-hand side of the Alerts table and select Export Alerts from the options list.
- Select the user account that will receive the list via the primary email address in their profile.
- After the request is processed in the background, the selected user will receive a custom secure link to download the export file via email. Note that this process can take up to an hour, depending on the number of Alerts to export.
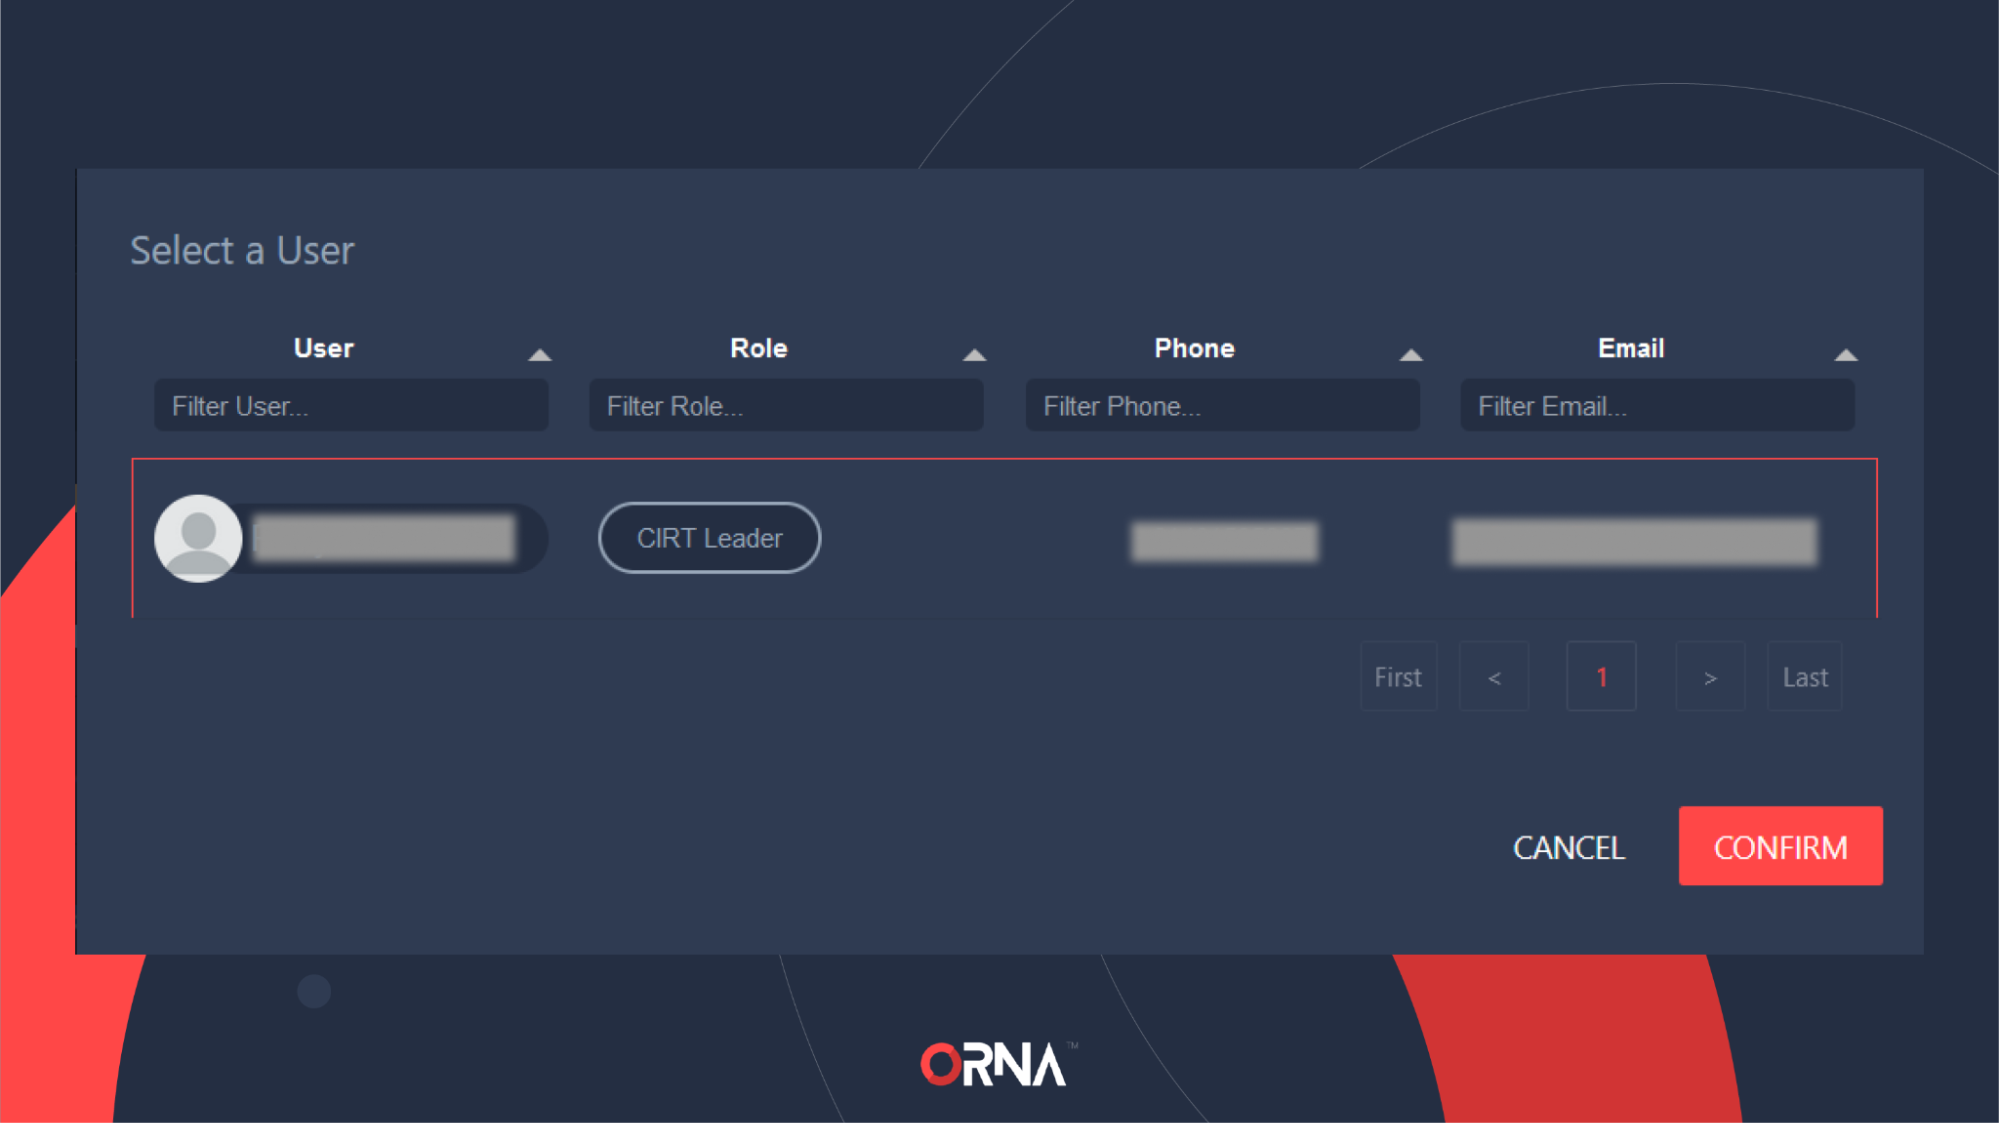
Selecting a user to receive the Alerts export link via email
Updated 9 months ago